
Share of Voice isn’t the best measure of PR strategy – here’s why
SHARE
Jessie Bland
12 Apr 2022
In a game of PR bingo, Share of Voice is likely up there with “Tier 1” and “key message penetration”, but what is Share of Voice and how does it get in the way of measuring PR success?
In this post, I’ll help you get started with PR Share of Voice measurement by answering these questions:
- What is Share of Voice?
- What’s the difference between Share of Voice in PR vs advertising
- Is Share of Voice useful for comparing with competitors’ PR?
- Is measuring Share of Voice valuable?
- Why Share of Voice pie charts alone are useless
- Are there alternatives to measuring Share of Voice?
What is Share of Voice?
Share of Voice (SoV) is an advertising measurement model.
According to Les Binet and LinkedIn’s B2B institute: “There is a strong relationship between market share growth and investment in advertising measured as ‘Share of Voice’. The relationship is very similar to that observed in B2C, implying that advertising works just as hard in B2B as B2C.”

It’s easy to read this and focus on the parallels between B2B and B2C but what I want to focus your attention on here is “investment in advertising”. That is what “Share of Voice” typically means to marketers. The principle being that the more you pay to be seen, the more you are seen.
It’s the reason that advertising buys indicate total impressions, frequencies, click-throughs etc. There’s a direct correlation between budget spent, opportunities to be seen and, consequently, market growth.
What’s the difference between Share of Voice in PR and advertising
The problem we have is when this direct correlation for advertising Share of Voice is applied to PR.
Typically Share of Voice in PR is measured by counting up a brand’s share of total coverage in a given period. This may be total coverage, it could be coverage in specific publications or it might even be measured by “total readership numbers”.
But here’s the rub…
Unlike advertising, the volume of media coverage is not directly correlated to budget (while of course there can be some connection). By that I mean: a small start-up with a killer campaign and a shoestring budget can garner a flurry of national coverage that an enterprise client might only dream of.
It’s why the term PR is regularly interchanged with media relations. Often, it’s the relationships PR teams – agency and in-house – have built-up with journalists and publications over time that impact whether a story lands.
When an advertising campaign has run, a media buying agency will be able to tell you how many people were served your ad, how many unique people saw, how many times and what they “look” like – gender, age, location and interest data.
That type of data – in the most part – doesn’t exist for earned media coverage.
This means that when it comes to analysing Share of Voice in PR – it isn’t as clear cut. There’s no intrinsic science to connect your media SoV with your market share.
Is Share of Voice useful for comparing with competitors’ PR?
The focus and fascination with Share of Voice in PR is in most part driven by an obsession with competitors, compounded by the idea that more coverage = better results. In fact, the obsession is often not even about the number of pieces of media coverage, but about the cumulative impression figure.
Now, there’s an innate issue with that. It’s fair to look at overall impressions as an indicator for your own brand – you have the context as to where those impressions came from.
But to calculate your Share of Voice means comparing your impressions against competitors – but without the context. It essentially treats every impression equally. Now, here’s the problem.
You could get coverage in a trade publication which has a stalwart readership of 12,000 people/impressions. A publication that, monthly, might be read by 45% of your target audience. And yet, a competitor might get a big national hit – in a less relevant publication – but because of the big impressions number, they win out in Share of Voice.
So you can start to see how it can be a misleading measure of success.
Is measuring Share of Voice valuable?
The second challenge with measuring SOV in PR, beyond the methodology, is the cost. Which, of course, is connected to the methodology.
To accurately measure it, in short, you need to replicate the coverage monitoring you have in place for yourself for your competitors. So if, for instance, you currently spend £1,250 a quarter on media monitoring, to track five competitors, you’ll likely have to multiply that by six – totalling a whopping £7,500 a quarter.
That’s a lot of budget to invest in often reiterating things you already know. That £25,000 could be spent getting more coverage than competitors, rather than paying for data that tells you that you’re getting less coverage than them.
Now, of course, there are a lot of “self-serve” tools or platforms that say they’ll allow you to measure SOV yourself. But then, you have the cost of the platform in the first place – plus, you have to define the search strings.
Share of Voice analysis: why pie charts alone are useless
Arguably, the biggest watch-out is that Share of Voice data alone isn’t very useful. Sure, you could argue that simply knowing a competitor is getting more or less coverage is enough to jolt you into action. But my counter to that would be that unless you know where they’re getting coverage, the quality of their mention in that coverage and the story or tactic that secured it, then you’re in no position to do anything about it.
It’s the qualitative analysis of the quantitative data that is more useful. Understanding what messaging a competitor is using, how they’re positioning their new product in a way that cuts-through, which “wish list” journalist they have managed to engage.
This is what allows you to consider how you react.
Of course, you could probably add this context – but the reality is that the SOV pie chart gets popped into a PPT with none of it. Meaning, senior leaders within a business often get a state of play with little counsel.
Are there alternatives to measuring Share of Voice?
So, by now, you’re probably starting to understand why I don’t recommend relying on SOV data as your font of knowledge, but if not Share of Voice, then what else? There are plenty of models, approaches and tools to measure share of voice.
- Review competitors’ quarterly earnings and annual reports to understand business direction and potential market, audience or brand impacts.
- Qualitative reports – rather than fixate on numbers, focus on the words. A qualitative research report carried out by an analyst or strategist is going to tell you more.
- Use a tool like Buzzsumo that’ll tell you the brands’ most shared earned or owned content – going beyond just impressions to look at content engagement.
- Consider a brand tracker that will help you identify the comms outcomes vs focusing only on the volume of outputs compared to competitors.
- Share of search – now this is likely to be a joint marketing and PR endeavour, but the wonderful Les Binet has evangelised the benefits of share of search, especially for consumer brands.
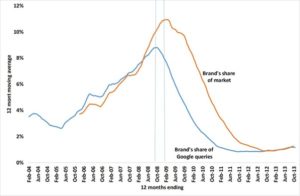
Image Credit: Les Binet
How to make the most of Share of Voice measurement
I recognise that there are many reasons SOV might need to remain one of the metrics you focus on to measure success, so here are a few ways to ensure you make it as useful as possible:
- Re-evaluate what you’re measuring a share of – and the parameters in place. How can you narrow the field to focus on key publications that matter to your audience?
- Add context to pie charts, so that no pie chart is shared alone. If competitor X achieved a bigger share, why did they and why does that matter? What can we learn from them?
- Use it to evaluate strategy. If you make a change in approach, how did that impact your own Share of Voice independent of competitors? If our coverage quality and volume has increased but a competitor’s also increased, that doesn’t mean our strategy didn’t work.
Want to learn more about comms measurement? Read my blog: Improving PR and marketing measurement.